How to Check Jacksonville Florida Real Estate Prices
Build a consistent view of Jacksonville home values, asking prices and sales, and understand what each measure can tell you.
Compare Jacksonville home prices with the right context. Paste this into your agent:
Set up https://monid.ai/SKILL.md, then find the available Jacksonville, Florida area home value and market statistics, identify their dates and explain what they do not tell me about an individual home.
One prompt starts your research.
As a buyer or property researcher checking Jacksonville Florida real estate prices, you can open a dozen listings and still lack an answer to a basic question: is the number you are looking at an asking price, a sale price, or an estimate of typical value? Each describes a different thing, and a single figure cannot stand in for all three.
Reading individual listings helps you see homes, but it does not by itself give you a consistent citywide comparison. A city summary also cannot tell you what a particular house is worth after its condition, location and recent comparable sales are considered.
This guide builds a repeatable research sheet with geography, dates and distinct price measures. We'll use Monid, a tool layer for agents, to show how an area overview can supply market context; then we'll separate that context from the property-level evidence and financing advice it does not supply.
Preview of the research sheet: keep one row per geography and observation date, with separate columns for typical value, median asking price and median sale price. The field descriptions below come from the inspected endpoint; they are not a live Jacksonville result or a promise that each value is populated.
What do Jacksonville Florida real estate prices mean?
A Jacksonville price is useful only when you know which homes, geography and date it describes. Start by labeling the number before comparing it with another number.
Separate asking prices from sales
An asking price is what a seller requests for a listed home. A sale price is the amount recorded for a completed transaction. A typical home value is an area-level estimate, while an individual home's estimated value concerns a particular property. These figures answer different questions even when all are expressed in dollars.
A median is the middle value in a set of observations. It describes the center of that set, not the exact price of a home you want to buy. If the mix of homes in a set changes, a comparison of its medians can change as well. Keep the definition and period with the figure so that a reader can tell what is being compared.
Keep the geography and date
A citywide number summarizes a wider area than a neighborhood or ZIP code. Record the area name and type rather than copying a figure into a column labeled simply “Jacksonville.” A ZIP code, neighborhood and city are different units; a difference between them does not, on its own, explain why one home costs more than another.
Dates matter for the same reason. Put the period of the underlying measure beside the date you collected it. A market statistic described as current on a page and a home value index described as a month-end figure are not necessarily observations for the same period. Do not give them a single shared date unless the source does so.
How to compare Jacksonville prices across areas
Compare areas using the same measure and period, then investigate differences at the property level. The aim is a defensible shortlist, not a citywide number presented as an appraisal.
Choose a consistent starting point
Start with Jacksonville as the citywide baseline. Then choose the neighborhoods or ZIP codes relevant to your commute, household needs or investment criteria. Write each geography in its own row, including the region type returned by the source. If a search resolves to a different place from the one you intended, correct the input before comparing figures.
Use the same source and the same metric for each row. Compare a typical home value with another typical home value, and a median sale price with another median sale price. A row with a missing value stays blank: replacing it with an asking price would change the question rather than complete the comparison.
Add the property context
Once an area fits your budget, inspect individual listings for the property features that matter to you. Beds, baths, area, condition and location within the region all affect whether a property is a useful comparison. A high-level index does not adjust a particular home for a new roof, needed repairs or differences in lot and layout.
Keep a separate list of candidate properties, with the source and observation date for each asking price. For a closer look at individual home estimates and their limits, see the Zestimate guide. Treat a listing as a starting point for investigation, and verify the terms and status with the relevant source before relying on it.
Avoid mixing time periods
A year-over-year change and a median sale price answer different questions. The first describes change over a defined interval; the second summarizes a set of sales. Write their source periods separately and avoid interpreting the change as the return on a particular purchase.
For a recurring report, preserve each previous snapshot rather than replacing it. That creates a record of what was available on each collection date and lets you see when a measure was missing. If a source revises a prior observation, record that revision rather than silently treating it as a new sale.
How to collect a consistent area snapshot
Use an area overview to collect the same categories of context for Jacksonville and the locations you want to compare. Monid's Zillow tools include zillow /get_neighborhood_data, an endpoint, or callable data operation, described as returning one area overview for a city, neighborhood or ZIP code.
The inspected description covers a typical home value, historical values, market statistics and region identity. It also says that some metrics are absent for some regions. The endpoint covers area context; it does not deliver a complete Jacksonville transaction dataset, a property appraisal or a lender's offer. This guide uses the published schema and description rather than a test response.
Step 1. Set up your agent
Get a key at app.monid.ai and give your agent the setup instruction below. The agent quickstart explains the installation.
set up https://monid.ai/SKILL.md
For a terminal workflow, install the CLI and add your key. The CLI quickstart covers the same setup for a person working directly in a shell.
npm install -g @monid-ai/cli
monid keys add -k <your-api-key> -l main
Step 2. Specify the place and the questions
Ask for Jacksonville, FL as the city input, then give the agent a separate list of neighborhoods or ZIP codes you actually want to assess. Ask it to keep the resolved area name and region type with every figure, as well as the source date for each measure.
Tell the agent not to substitute an asking price when a sale price is missing and not to infer the value of an individual property from an area index. These instructions make the final sheet easier to audit and prevent a convenient but misleading filled cell from becoming a decision.
Step 3. Inspect the area tool
Discovery and inspection are free. The following commands find the tool and show its input and pricing; the inspected input requires a location query parameter and uses the first matching region.
monid discover -q "Jacksonville Florida home values"
monid inspect -p zillow -e /get_neighborhood_data
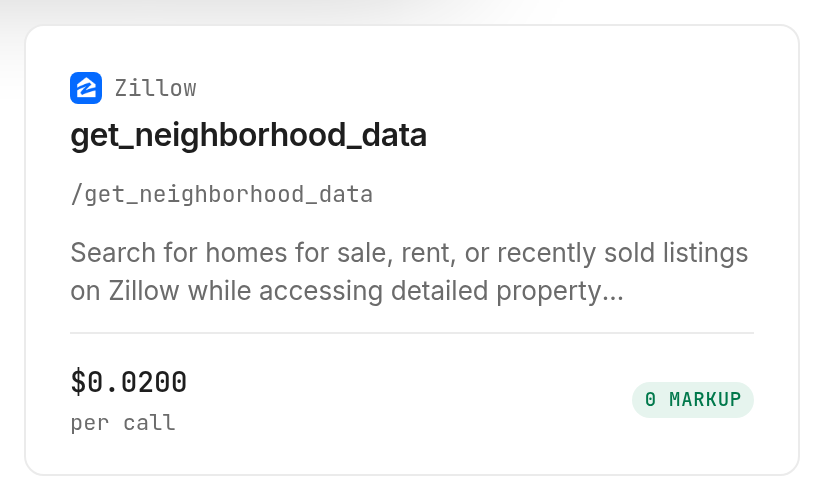
The listed rate is $0.02 per call, Verified 2026-11-20. The Zillow tool page shows the current listing. This is a per-call price, not a price per returned property. Inspect the listing before collecting multiple areas, and decide which places are worth adding to your sheet.
Step 4. Collect and label the response
The CLI accepts the location as a query parameter. A call is the paid step; collect one city first and confirm the returned region before requesting additional areas.
monid run -p zillow -e /get_neighborhood_data --query '{"location":"Jacksonville, FL"}' -w
Save the returned record with the collection date. Keep missing values as missing, and retain the source's own period for each available statistic. The guide does not show an actual response: the endpoint was inspected but not run for this article.
How to read the figures
Read the returned area and period first, then read each price as a separate measure. The inspected endpoint description declares the following response information; it does not establish what a Jacksonville call will return today.
| Area overview information | What the endpoint describes | How to use it |
|---|---|---|
| Region identity | Name, region type and region ID | Confirm the selected place before comparing it. |
| Typical home value | typicalHomeValue and a month-end observation | Compare the same index and period across areas. |
| Value history | Monthly history and one-year change | Examine the period and direction, not an individual home's return. |
| Market statistics | Median list price, median sale price and inventory | Keep asking and completed-sale measures in separate columns. |
| Rent context | Typical rent and history when available | Treat rent as a separate measure from purchase price. |
| Local context | Parent regions and nearby or sub-regions | Check the geographic level before drawing a comparison. |
Interpret a missing figure
A missing statistic is a gap in the source record, not a zero. The inspected description says some smaller regions have null values or empty history arrays for certain metrics. Keep that distinction in the export, and write “not available” in the report rather than calculating with an empty field.
Missingness also changes the scope of your comparison. If one area has a sale-price figure and another does not, you can compare their available typical-value figures, but you cannot claim to have compared sale prices for both. Return to a suitable transaction source if sold prices are essential to the decision.
Inspect the shape before building a spreadsheet
The area overview is one record for a resolved region, not a complete list of all homes sold in that region. Its description includes featured properties, but a small selection is not a representative sample of every transaction. Keep a separate sheet for individual listings and comparable sales, with a property identifier and observation date where available.
The real estate tools page is a place to inspect other operations when the next question concerns individual homes. For the next step, the guide to property valuation before buying explains how to investigate an individual home. Do not merge those records into an area median without documenting the set and calculation.
How to turn the snapshot into a buying decision
Use the area sheet to narrow the search, then use comparable properties and financing information to assess each candidate. Your area snapshot is a research aid; it is not a valuation of the house or a calculation of your full cost of ownership.
Build a shortlist with explicit criteria
Write down the places you are considering and the measure that screens them. For example, you might use a typical value to identify areas for further research, then compare current listings that meet your needs. Keep your budget in a separate column from the market statistic so you do not confuse a personal limit with an observed price.
Review every area with the same rules. A low typical value does not establish that every home in the area meets your requirements, and a higher citywide value does not establish that every listing is outside your range. Move from the area level to actual properties before rejecting or selecting a home.
Add the costs the area figures leave out
The purchase price is one part of the decision. Ask for property-specific information about financing, insurance, taxes, maintenance and any association charges, and put those amounts in a separate budget. A citywide home value or median sale price does not include your individual financing terms or the repair work a property needs.
Keep assumptions visible. If you use a lender's quote, record its date and the loan terms alongside it. If you use a repair estimate, record who prepared it and which work it covers. This makes the difference between a market screen and your own purchase budget clear to anyone reviewing the sheet.
Revisit the sheet before acting
Repeat the same collection for the areas that remain on your shortlist and retain the earlier observations. Check whether each new record describes the same geography and whether its underlying period has changed. If either differs, label the change rather than displaying the two values as a clean time series.
For an individual home, check the listing status and current asking terms at the source and discuss recent comparable sales with a qualified local professional. A repeatable area report makes the first pass easier; it does not replace a property inspection or a contract review.
When should you use another source?
Use Zillow's own public home-value pages when you want to read a single area directly in a browser. Use local transaction records and a qualified real estate professional when your question is what a particular home should be worth. Use a lender when you need an actual financing offer for your circumstances.
This is the Monid blog, and Monid provides access to the area tool described here. Its limitation for this task is material: the inspected operation describes an area overview, not a complete set of comparable sales or an appraisal. A direct public page suits a one-off lookup; a repeatable agent workflow suits a sheet that must preserve the same fields across several areas. Choose the source that answers the decision in front of you.
Which tool fits the job?
The inspected area operation is the tool in this guide for area context. Its described output is an overview, so use a separate property and transaction research process for a house-specific decision.
| Use case | Best endpoint | Why? |
|---|---|---|
| Compare city and neighborhood context | zillow /get_neighborhood_data | Area identity, typical values and market statistics; inspect only, $0.02 per call, Verified 2026-11-20. |
The price is for a call to the Zillow tool. The inspected description does not establish how failed requests are charged, so check the applicable billing information before relying on a cost estimate for a batch.
Conclusion
A useful Jacksonville price comparison keeps the place, period and type of price together, then moves from area context to individual homes and financing. The inspected area tool gives you a way to repeat the context-gathering step across locations; the resulting shortlist gives you a clearer basis for investigating the properties that fit your needs.
FAQ
What are Jacksonville Florida real estate prices?
There is no single price for every Jacksonville home. Check a dated city or neighborhood measure, identify whether it is a typical value, asking price or sale price, and examine individual comparable properties for a specific home.
How do I compare Jacksonville neighborhoods?
Compare the same measure for each resolved geography and period. Keep region names and types in the sheet, then assess listings and comparable sales separately.
Is a typical home value the same as a sale price?
No. A typical home value is an area-level estimate, while a sale price is the amount for a completed transaction; a median sale price summarizes a set of transactions.
Can I check prices without writing code?
Yes. You can read a public area page directly or give an agent the research prompt and review the resulting sources, dates and geography.
What does the area overview cost?
The Zillow area overview is listed at $0.02 per call, Verified 2026-11-20. Discovery and inspection are free; a data call is the paid step.
Does an area price tell me what a specific house is worth?
No. A property-specific assessment needs relevant comparable sales and information about the home's condition and features.
Can I repeat this comparison later?
Yes. Save the original observation, run the same area lookup again when needed, and record both the collection date and the period of each source statistic.
Published November 2026.